Dashboard
Path: /dashboard
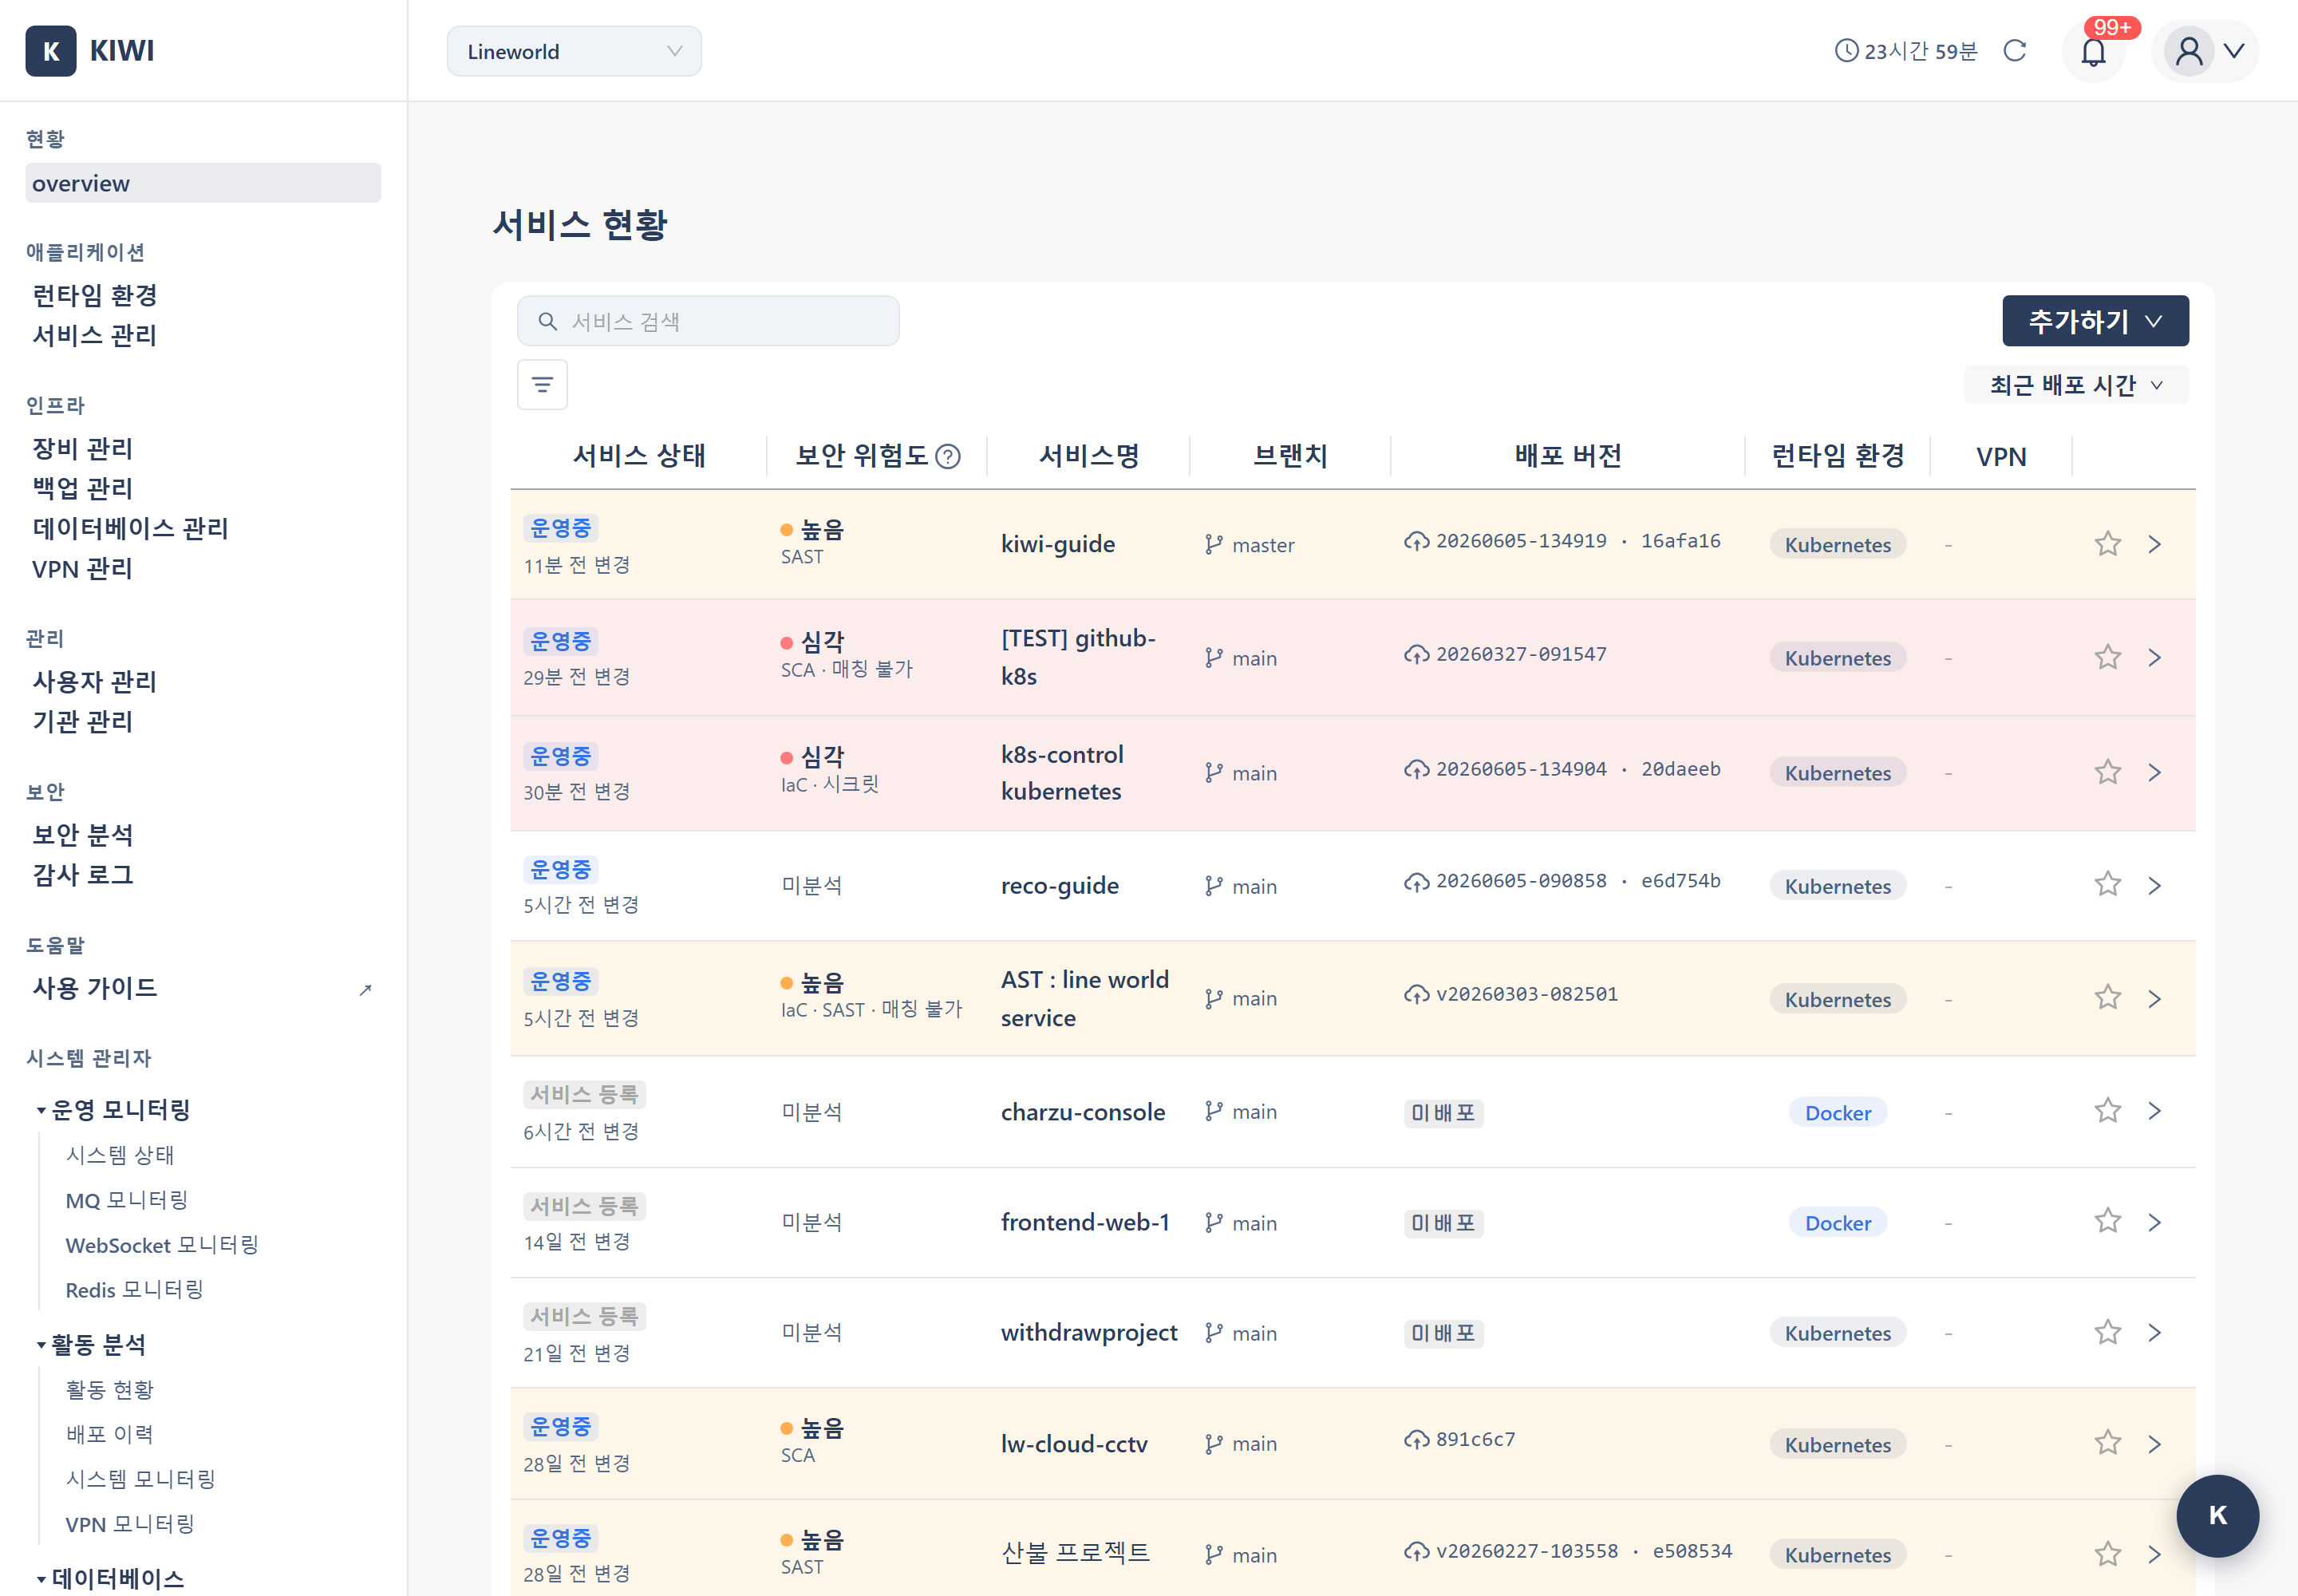
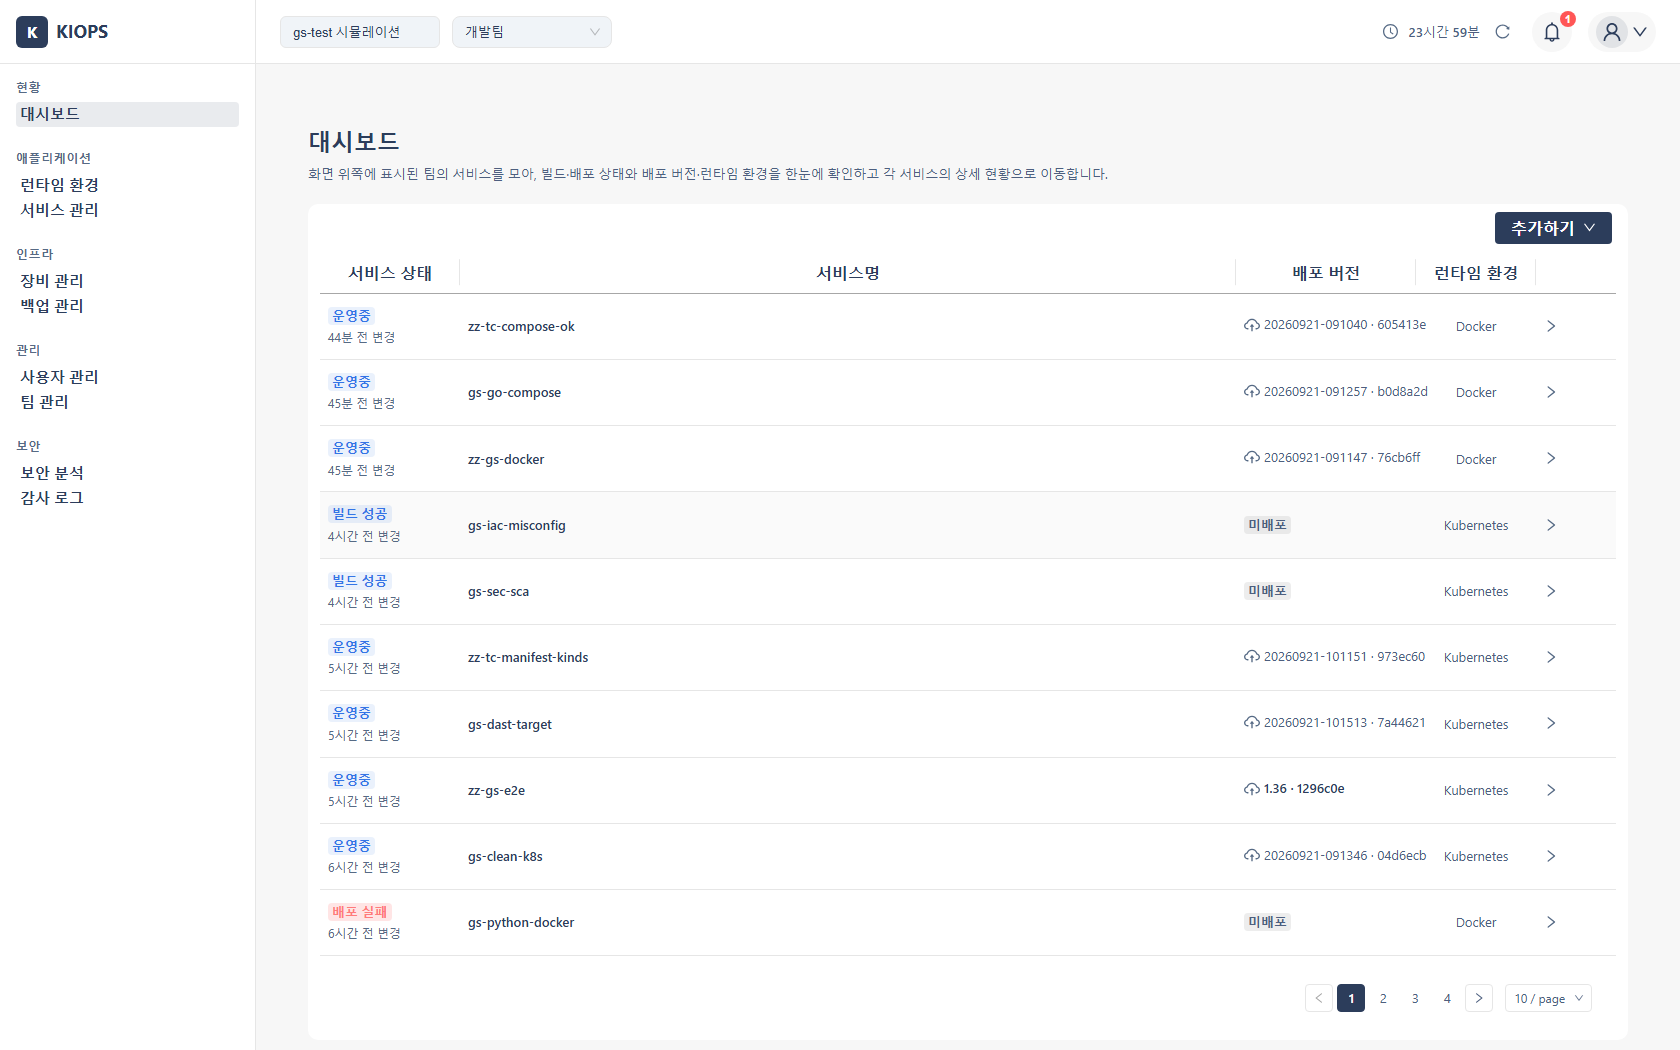
The first screen you see after logging in. It gives an at-a-glance view of every registered service's status and security posture. The Dashboard is monitoring only — run builds and deployments from the [Service Management] page.
Permission Required — If you cannot access this page, ask your organization admin for permission.
What you can do here
- Check service status: Each service's live status is shown as a badge, with the time of the last change as relative time. For badge meanings and responses, see the Status Reference.
- Check security risk: Shows each service's security score (0–100), grade (A–F), and severity. It uses the same formula as the [Security Analysis] overview tab, so the numbers match. For grade meanings see the Status Reference; for the formula see Security Analysis.
- Open service details: Click a service name to open the detail view with the pipeline flow, runtime status, and connected resources.
- Favorites: Pin frequently viewed services to the top of the list (saved to your account and synced across devices).
Key elements
- Service list table: Service status · Security risk · Service name · Branch · Deployed version · Runtime · VPN · Actions (favorite/detail). When several services share the same Git repository, the Branch column lets you switch between the branch services. Which columns appear depends on your environment — the security risk, favorite, and VPN columns are not shown where those features are unavailable.
- Add dropdown: Opens the registration modals for [Devices], [Runtime Environments], and [Service Management] right from the Dashboard.
- Real-time updates: Auto-refreshes over WebSocket (on disconnect an indicator appears and it reconnects automatically); no manual refresh needed.