Pod & Container Management
Once your service is deployed, there will be times when you need to manage workloads directly. This includes restarting problematic Pods/containers or adjusting scale in response to traffic increases.
This feature shows different tab names and capabilities depending on the runtime. Refer to the section that matches yours.
- Kubernetes: Pod status and bulk deletion are in the [Pod List] tab; scaling and HPA are in the [Workload] tab of the operations modal.
- Docker · Podman: The [Container List] tab in the operations modal. Supports Restart, Stop, and Remove actions (no scaling or HPA).
Containers are the "homes" where your applications live. When something goes wrong with the home, the resident (your application) is affected too. Good Container management improves service stability.
Feature Overview
Different features are available depending on whether you use Kubernetes or Docker/Podman.
- List: Kubernetes shows the Pod list; Docker/Podman shows the Container list.
- Status: Kubernetes shows Running/Pending/Failed etc.; only
runningis highlighted in the UI. Docker/Podman showsup/exitedetc. - Restart: In Kubernetes, restart is achieved by deleting the Pod (the Deployment recreates it). Docker/Podman provides Restart, Stop (when running), and Remove actions.
- Start: The Container List tab in the operations modal has no action to start a container directly (Start). Instead it provides Restart, Stop (when running), and Remove actions.
- Scaling: Kubernetes adjusts Deployment replicas (Apply Pod Count / Remove All Pods). Docker/Podman does not support scaling.
- Auto-scaling: Kubernetes uses HPA (CPU-based only). Docker/Podman does not support it.
- Connection method: Use the Change Connection Method button next to the connection status at the top of the operations modal to choose VPN / Direct SSH (when the target supports both direct and VPN access).
In Kubernetes, even if you delete a Pod, the Deployment automatically creates a new one. This is the "self-healing" feature.
Kubernetes Pod Management
Viewing Pod List
- Operate → Pod List tab
- View the list of currently deployed Pods.
Pod Information Table
The actual columns are:
- Status: Running, Pending, Failed, etc.
- Pod name: Deployment-XXXXX-XXXXX format
- CPU: CPU usage
- Memory: Memory usage
- Image: Current container image
- Actions: Action buttons such as Restart
The "Creation time" column is not displayed. (The "Restart" column is displayed and shows the container restart count.)
Understanding Pod Status
In the UI, the running state is highlighted in blue, pending is shown in orange, failed/error states are shown in red, and all other states are shown in gray.
- Running: Pod is running normally.
- Pending: Pod is waiting for scheduling. Common causes are insufficient resources or image pulling in progress.
- Failed: Pod has failed.
- CrashLoopBackOff: Pod has failed repeatedly.
- ImagePullBackOff: Image pull has failed.
- Terminating: The Pod is being terminated. It has no separate color mapping, so it is shown in gray like other unspecified states.
Pod Detail Expand Area
The expand icon (View root cause) is shown only for Pods in the Pending state. Expanding such a row reveals:
- Root cause analysis: Guidance for the possible causes of a Pending state (insufficient resources, nodeSelector/affinity, PVC binding, Taints/Tolerations, etc.).
- Events: K8s events related to the Pod.
- Force Delete: Force-delete button for Pending Pods that do not terminate via normal deletion.
Not only Pending Pods but also Pods in abnormal states such as ImagePullBackOff, CrashLoopBackOff, OOMKilled, Evicted, or Error/Failed can have their rows expanded to reveal "Root cause analysis" and state-specific "Resolution" panels. (Only Pods in a healthy Running/Completed state cannot be expanded.) There are no separate "View Logs" / "Details" actions; logs are viewed from the Log Viewer tab.
Pod Actions
The Actions area provides a Restart action only. It works by deleting the Pod, after which the Deployment recreates it automatically.
Bulk Delete Pending Pods
The Bulk Delete Pending Pods button is shown only when Pending Pods exist and you have K8s restart permission.
- Click the button.
- Approve in the confirmation dialog.
- All Pods in the Pending state are deleted.
Scaling (Kubernetes)
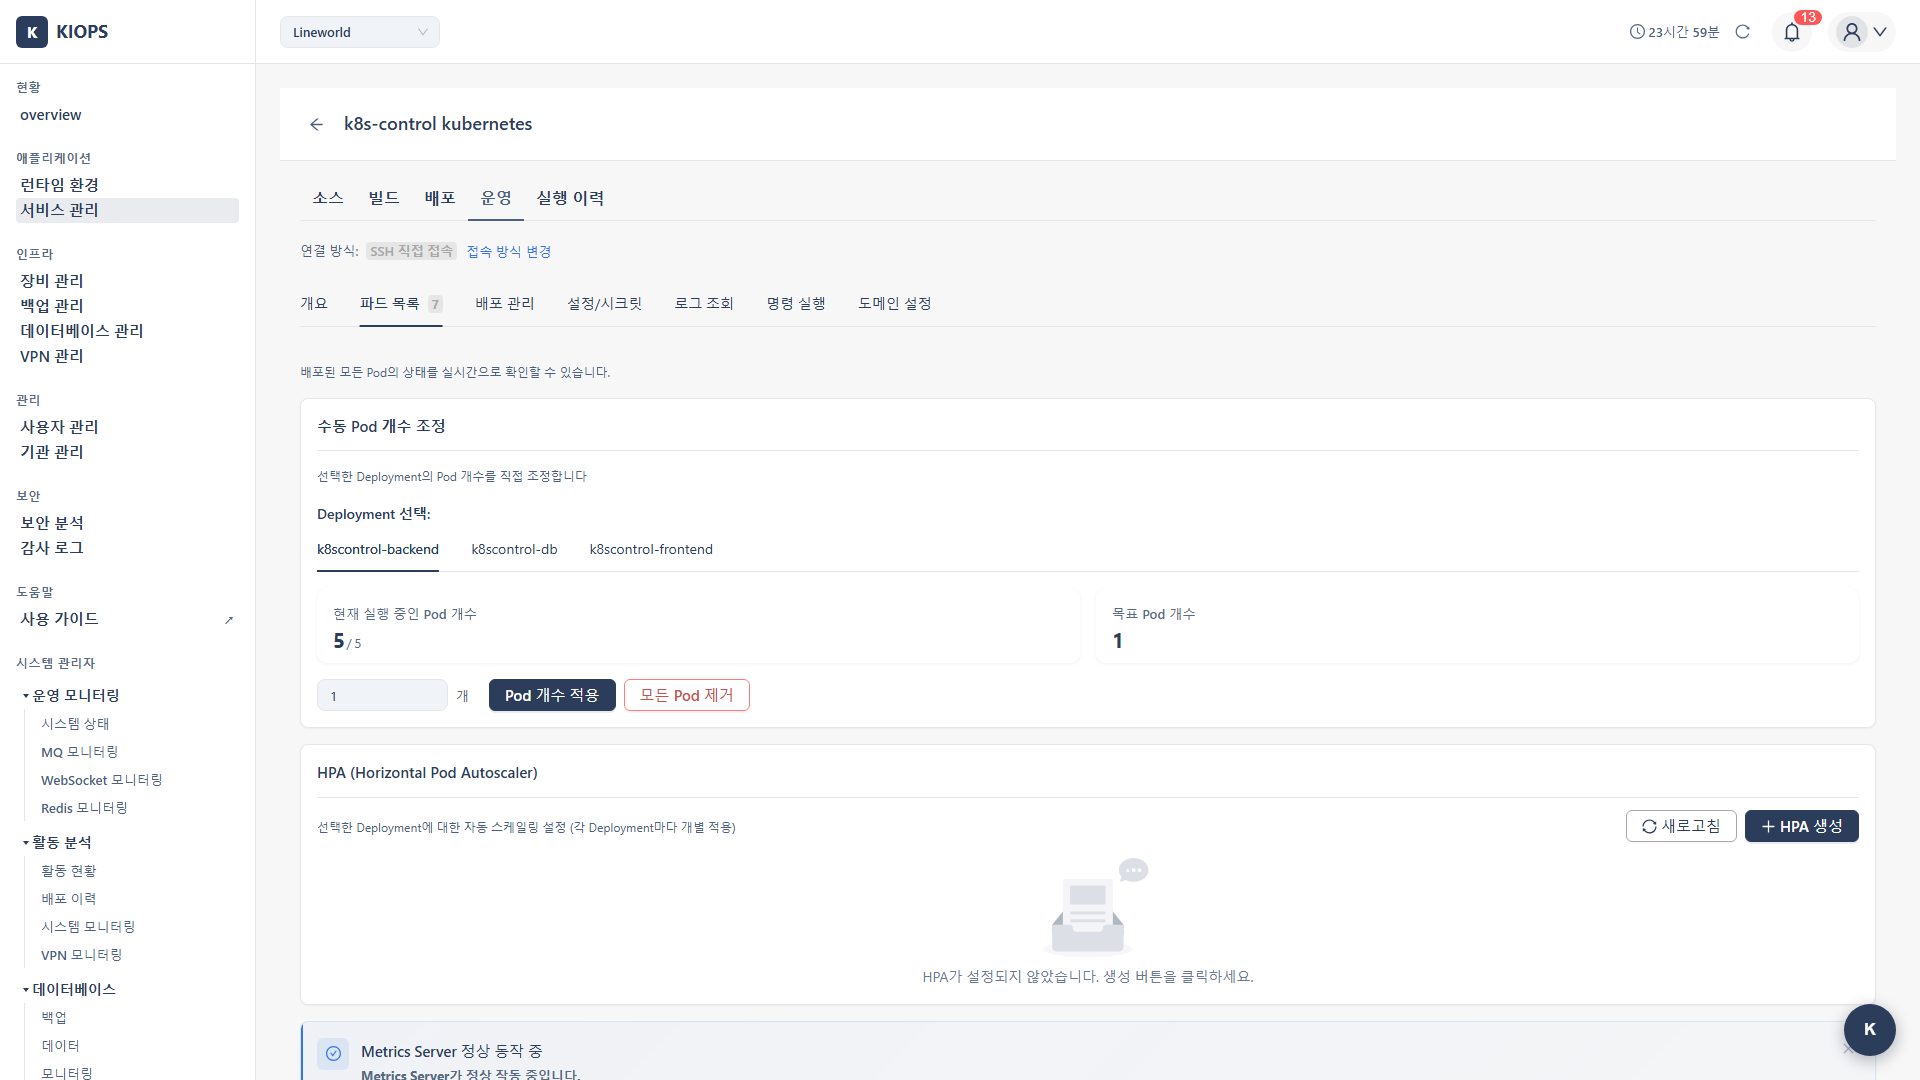
Manual Scale
-
Select a Deployment in the Workload tab.
-
Enter the desired Pod count.
-
Perform one of two actions:
- Apply Pod Count: Sets replicas to the entered count.
- Remove All Pods: Sets replicas to 0 and removes all Pods.
Manual scaling is locked while an HPA is active. The backend also blocks kubectl scale in that case.
HPA (Horizontal Pod Autoscaler)
HPA automatically adjusts Pod count based on CPU usage.
Manual scaling takes time and is prone to errors. With HPA configured, you can automatically respond to traffic changes.
Creating an HPA
- Navigate to the HPA section in the Workload tab.
- Click the Create HPA button.
- Enter the following settings.
HPA Settings:
- Minimum Pod count (default 1, recommended 2): Minimum Pods to always maintain.
- Maximum Pod count (default 10): Maximum Pods to scale up to.
- Target CPU utilization (default 80): Pods are added when CPU exceeds this level.
- Click the Create button.
KIOPS's HPA supports CPU-based auto-scaling only and is created internally via kubectl autoscale --cpu-percent. If an HPA already exists, it is deleted and recreated. Memory-based auto-scaling, multiple metrics, custom metrics, scale stabilization windows, and scaling policies are not supported.
HPA requires metrics-server to be installed on the cluster. Unlike the resource figures shown in KIOPS, HPA depends on the metrics.k8s.io API, and KIOPS does not install it for you. See Pod Resource Metrics.
How HPA Works (CPU-Based)
Current CPU 85% → Target 80%
→ Need to increase replicas
→ Automatic Scale Up
→ CPU load is distributed
HPA Card Information
Once an HPA is created, a card displays:
- HPA name
- Target Deployment
- Min / Max Pods
- Target CPU(%)
- Currently running Pod count
- Delete button
Clicking the Delete button removes the HPA and returns to manual scaling.
Resource Metrics
Pod CPU and memory come straight from the kubelet's built-in metrics, so no installation is required. See Pod Resource Metrics for what to check when values are empty.
The Pod List tab also provides diagnostic tools based on events and Pod logs, plus an Image Cache Cleanup action for when an image pull failure is suspected.
Docker · Podman Container Management
Docker and Podman behave identically in the operations screen and feature set.
Viewing Container List
- Operate → Container List tab
- View the current container list.
Container Information Table
The actual columns are:
- ID
- Name
- Image
- Status
- CPU
- Memory
- Network
- Ports
- Actions: Restart, Stop (when running), and Remove (with manage permission) actions
The "Creation time" column is not displayed.
Auto-Refresh and Statistics
- Auto-refresh toggle: When enabled, the container list and stats refresh every 30 seconds.
- Stats button: Displays CPU / memory / network usage.
Container Control
The Container List tab in the operations modal provides Restart, Stop, and Remove actions. The Stop button appears when the container is running, and the Remove button appears when you have management permission (canOperateManage). A Start button is not provided.
- Click the action button in the row of the container to restart.
- Approve the confirmation dialog.
- Confirm completion.
For finer control (Start/Stop/Remove, image changes, etc.), use docker/podman commands in the Command Execution tab. If you need to redeploy, run the build/deploy again from the [Service Management] page. (The operations modal has no separate "Deployment Management" tab.)
Real-World Usage Scenarios
Let's look at how to manage Containers in real situations.
Scenario 1: Responding to a Traffic Surge (K8s)
Here's how to respond when users suddenly flood in and the server slows down.
- Check the current status in the Pod List tab.
- If CPU usage is high, scaling is needed.
- Enter Pod count 3 → 5 and click Apply Pod Count.
- Confirm that new Pods are being created.
- Load is distributed and response times improve.
It's a good idea to increase Pod count ahead of expected traffic surge events.
Scenario 2: Automating with HPA
If manual scaling is tedious, set up HPA.
- Identify services that frequently need manual scaling.
- Click the Create HPA button.
- Set minReplicas 2, maxReplicas 10, targetCPU 70%.
- Complete creation.
- From then on, scaling happens automatically based on CPU utilization.
Scenario 3: Restarting a Problematic Pod
Here's how to fix a Pod stuck in CrashLoopBackOff status.
- Discover a Pod in CrashLoopBackOff status.
- Identify the root cause from the Log Viewer tab.
- Combine with the per-error-type analysis and events in the Pod List expand row.
- Fix the problem (configuration, code, etc.).
- Restart (delete) the Pod. If normal deletion fails, use Force Delete.
- Confirm the new Pod is in normal Running status.
Troubleshooting
Kubernetes
- Pod stuck in Pending: Insufficient resources. Add a node or reduce resource requests.
- Scaling not working: There is no Deployment, or an HPA is active and locks manual scaling. Check whether HPA is enabled and the Deployment status.
- HPA not working: metrics-server is missing from the cluster. Verify with
kubectl top nodes; a cluster administrator must install it directly.
Docker · Podman
- Restart failing: Port conflict or volume issue may be the cause. Inspect the Log Viewer or use Command Execution.
- Cannot connect: Cannot access the server. Check the Change Connection Method button next to the connection status (VPN / Direct SSH) at the top of the operations modal.
Related Guides
- Log Monitoring - Log viewing
- Remote Command Execution - Command execution and streaming mode
- Rollback - Restore previous version