Pod Resource Metrics
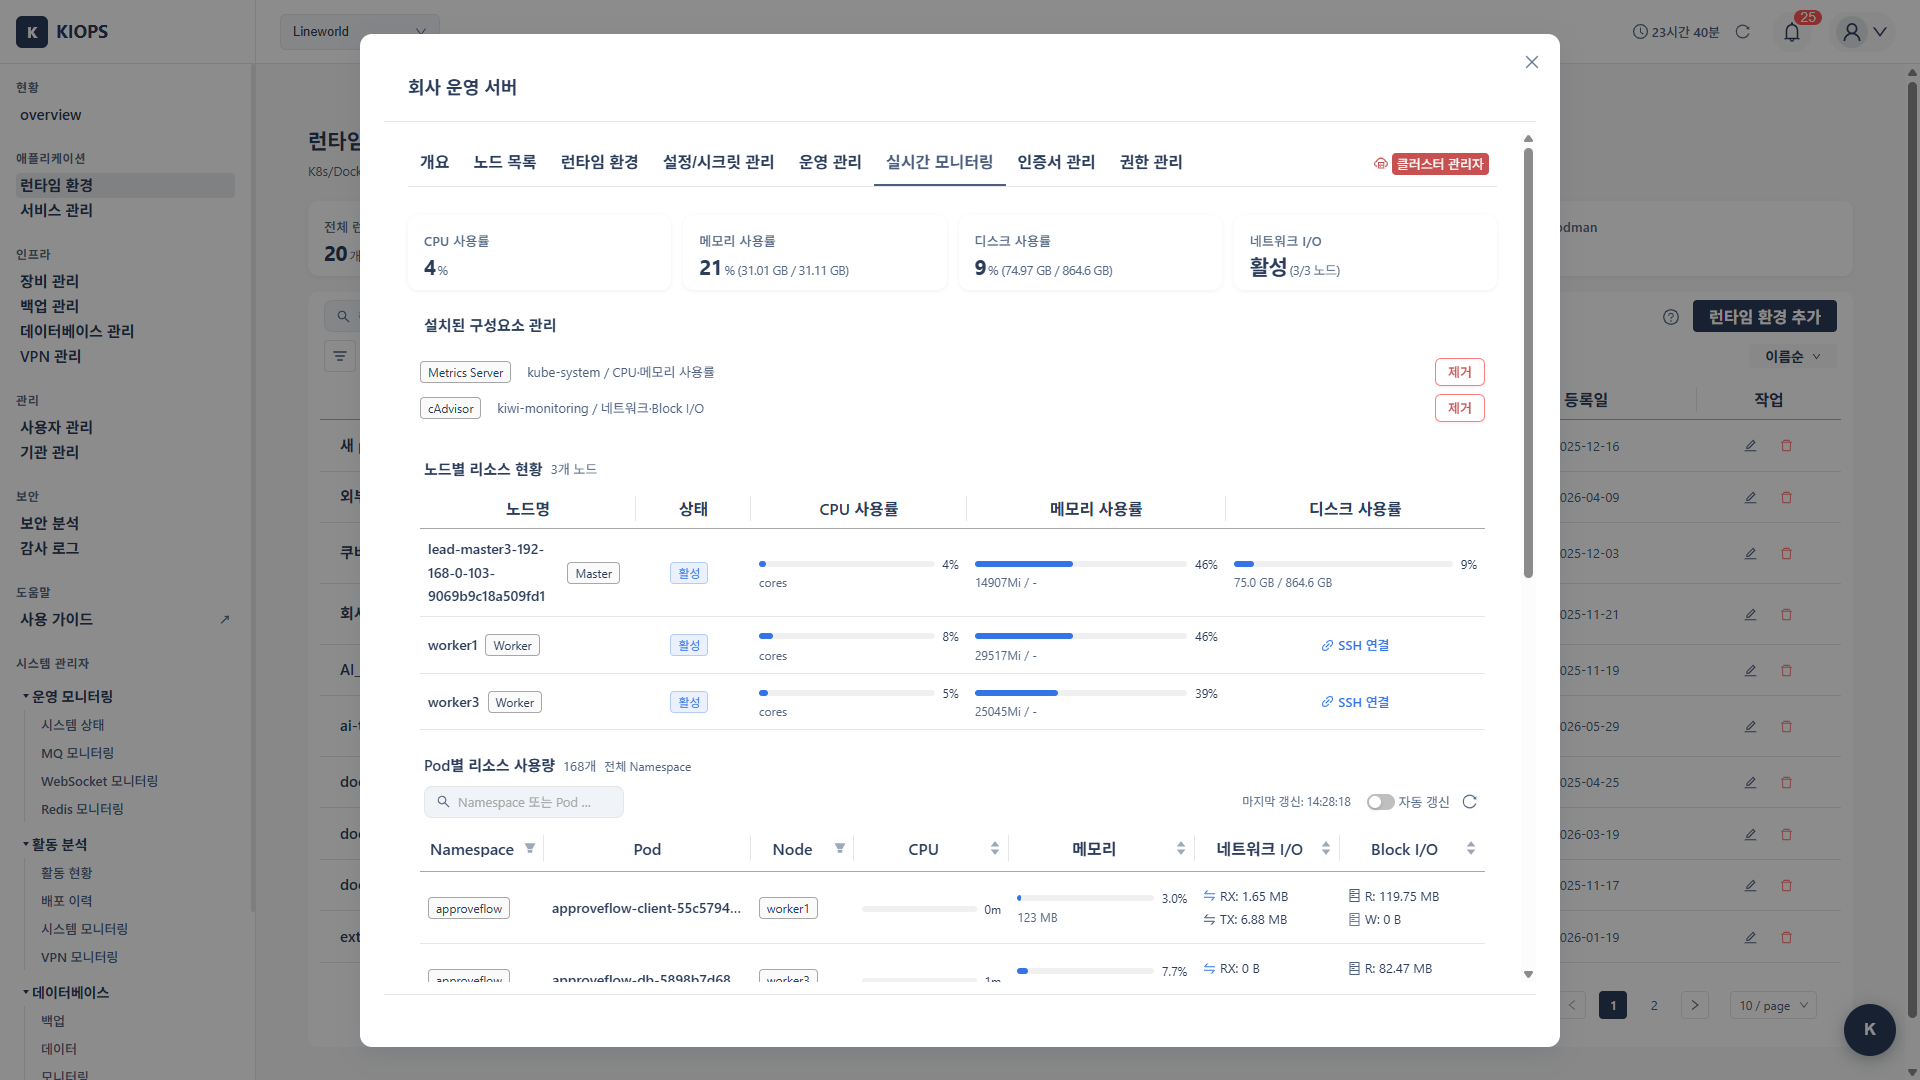
What do you need to install to see how much CPU a Pod is using, or whether it is approaching its memory limit? Nothing. KIOPS reads the metrics that the Kubernetes kubelet already exposes. Resource usage therefore appears as soon as you register a cluster.
No Installation Required
Earlier versions of KIOPS installed metrics-server and a cAdvisor DaemonSet into your cluster to collect resource metrics. Neither component is needed now, and the corresponding install/uninstall UI is no longer provided.
- CPU and memory: collected from the kubelet's
stats/summaryendpoint. - Network and disk I/O: collected from the cAdvisor built into the kubelet (
metrics/cadvisor). - Both are queried through the Kubernetes API server proxy, so no additional workload is deployed to your cluster.
This change removes the installation, permission, and lifecycle burden from your cluster. It also resolves an issue where the previous cAdvisor DaemonSet exposed port 8080 without authentication on every node interface.
There is no install menu for metrics-server, cAdvisor, or the Prometheus Stack
The Real-time Monitoring tab used to offer "Install Metrics Server" and "Install I/O Monitoring" (cAdvisor or Prometheus Stack). Both entry points have been removed, and KIOPS no longer installs any monitoring stack into your cluster on your behalf.
- If you want to run Prometheus/Grafana for your own purposes: a cluster administrator should install it directly. The metrics shown in KIOPS work independently of it.
- If you want to use HPA: metrics-server is required (see HPA Still Requires metrics-server below).
Where to Find Metrics
Resource usage is shown in three places.
- [Runtime Environment] > cluster detail > Real-time Monitoring tab: per-node and per-Pod CPU/memory plus network and disk I/O, in real time.
- Service Operations > Pods tab: CPU/memory usage for the Pods belonging to that service.
- [Dashboard]: a summary of cluster-wide resource usage.
Values refresh on a collection interval, so a short delay is normal. Network and disk figures are derived from the deltas of cumulative counters, so they may be empty immediately after the first query. Check again shortly afterwards.
Prerequisites
There is nothing to install, but KIOPS needs the following in order to read kubelet metrics.
nodes/proxypermission: the kubeconfig (or ServiceAccount) KIOPS uses must be able to access thenodes/proxyresource. The default admin kubeconfig on a node, and the admin kubeconfig you supply when registering an external cluster, already include this permission.- kubelet port 10250: each node's kubelet must be reachable from the API server. If a node's firewall blocks port 10250, only that node's metrics will be empty.
- The cluster must be registered in KIOPS.
HPA Still Requires metrics-server
The resource figures shown in KIOPS are read directly from the kubelet and need no installation. HPA (auto-scaling), however, works by having the Kubernetes HPA controller query the metrics.k8s.io API, and that API is only available when metrics-server is installed in the cluster.
KIOPS no longer installs metrics-server on your behalf, so a cluster administrator must install it directly if you want to use HPA.
If you have direct access to the cluster, check whether it is installed:
# Check whether the metrics.k8s.io API is available
kubectl top nodes
If this prints error: Metrics API not available, metrics-server is missing. Apply the official Kubernetes distribution to the cluster before configuring HPA. In environments using self-signed certificates, the metrics-server Deployment may need the --kubelet-insecure-tls flag.
See HPA Autoscaling for how to configure HPA.
Troubleshooting
All resource usage is empty
- Insufficient permission: without
nodes/proxypermission, queries fail for every node. Check the KIOPS ServiceAccount permissions under the [Runtime Environment > Permissions] tab. - Cluster connectivity: check the cluster connection status on the [Runtime Environment] page first. If the API server is unreachable, metrics cannot be collected either.
Only one node has no values
KIOPS cannot reach that node's kubelet. Allow port 10250 in the node firewall and confirm the node is in Ready state.
Only network and disk are missing
Network and disk come from a different endpoint (metrics/cadvisor) than CPU and memory. If CPU/memory appear but network/disk do not, that node's kubelet may be configured not to expose cAdvisor metrics.
Common Mistakes
- Expecting KIOPS screens to become more accurate after installing metrics-server: the display path is fixed to direct kubelet queries and does not change. Install metrics-server only for HPA.
- Leaving behind the cAdvisor DaemonSet installed by an earlier KIOPS version: the cAdvisor DaemonSet in the
kiwi-monitoringnamespace is no longer used. It exposes port8080without authentication viahostNetwork, so removing it is recommended.
Related Guides
- Runtime Environment - Registering a Kubernetes cluster
- HPA Autoscaling - Configuring auto-scaling
- Log Monitoring - Viewing container logs
- Container Management - Restarting and scaling Pods