Operations Management
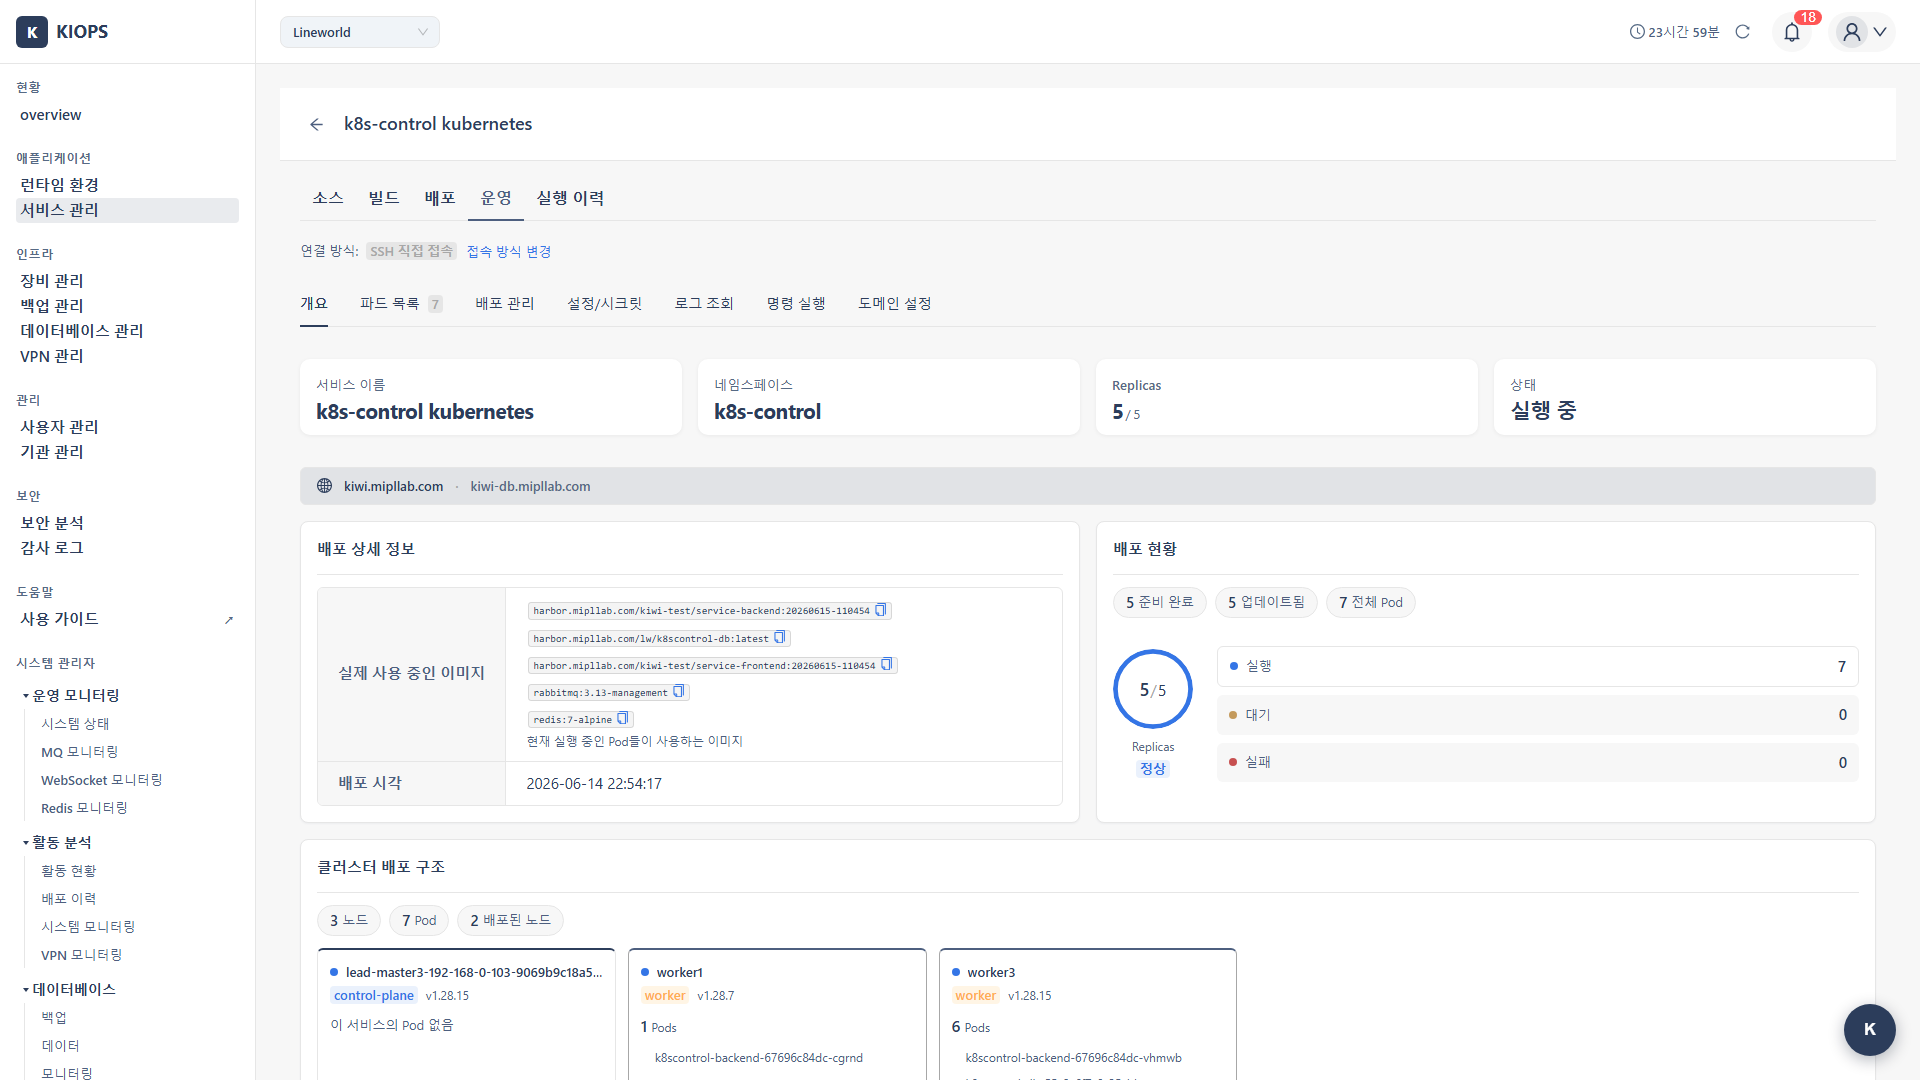
Once you have deployed your service, the real work begins. KIOPS's Operations Modal (Operate Modal) lets you manage and monitor your deployed service's Pods and Containers in real time.
This guide answers the post-deploy question "OK, what do I look at and where?" by collecting the Operations Modal tabs on a single page. The number of tabs varies by runtime type and permissions (K8s up to 8 / Docker/Podman up to 5). Day-to-day actions - logs, command execution, scaling, and more - are all handled in one place.
Deployment is just the beginning. Real-world service operations require log monitoring, resource tracking, troubleshooting, scaling, and more. KIOPS's Operations Modal brings all these tasks together in one convenient place.
Before You Start: Terms to Know
A short primer on terms you meet often in the Operations Modal. Refer back here when a term first appears in the text.
- Operations Modal (Operate Modal): A screen for working deeply on a single service (Overview / Pod or Container List / Log Viewer / Command Execution / Domain Settings; K8s adds Workload, Resources, and Config/Secret tabs). The number of tabs varies by runtime and permissions.
- Pod: The smallest deployable unit in K8s, wrapping one or two containers together (think of it as a household sharing a single home).
- Container: The smallest unit where the actual app runs in Docker/Podman.
- HPA (Horizontal Pod Autoscaler): A K8s feature that automatically scales the Pod count up and down based on CPU usage. (KIOPS supports CPU only; memory-based HPA is not supported.)
- Command execution (one-shot / streaming): One-shot runs once and returns the result (30-60 s timeout); streaming streams the output for up to 10 minutes.
- Log Viewer: Pulls a snapshot of a Pod or container's stdout once (for real-time streaming, use the streaming mode in the Command Execution tab).
- Connection method (VPN / Direct SSH): How the Operations Modal reaches the target infrastructure.
Operations Feature Overview
flowchart TB
    A[Operations Modal] --> B[Overview]
    A --> C[Pod List / Container List]
    A --> W[Workload - K8s only]
    A --> D[Resources - K8s only]
    A --> H[Config/Secret - K8s only]
    A --> E[Log Viewer - permission required]
    A --> F[Command Execution - permission required]
    A --> G[Domain Settings]

    H --> H1[ConfigMap/Secret key-value management]

    C --> C1[List]
    C --> C2[Status]
    C --> C3[Delete/Restart]
    W --> W1[Deployment Manual Scale / HPA]

    D --> D1[Resource View / YAML]
    D --> D2[Resource Cleanup Delete]

    E --> E1[Pod / Container Logs]

    F --> F1[One-shot Command]
    F --> F2[Streaming Mode]
Supported Features by Runtime
Different features are available depending on whether you are using Kubernetes or Docker/Podman.
- Pod/Container Management: Kubernetes supports Pod list, status, restart (via deletion), and bulk Pending Pod deletion. Docker/Podman provides container listing along with Restart, Stop, and Remove actions. (Stop is shown for running containers, and Remove is shown when you have management permission.)
- Scaling: Kubernetes supports manual Deployment scaling and CPU-based HPA. Docker/Podman does not support scaling.
- Log Viewing: Kubernetes views Pod logs; Docker/Podman views container logs.
- Command Execution: K8s mode takes a full
kubectlcommand. Docker/Podman mode treats container selection as optional and runs on the host when no container is selected. - Resource Monitoring: Kubernetes collects the kubelet's built-in metrics with no separate installation. Docker/Podman provides a 30-second auto-refresh toggle and CPU/memory/network statistics.
- Domain Management: Kubernetes manages Ingress; Docker/Podman manages service domains.
- ConfigMap/Secret Management (K8s only): Edit ConfigMaps and Secrets as key-value pairs per namespace from the Config/Secret tab of the Operations Modal. Requires management permission.
- DAST Scan: Supported on both Kubernetes and Docker/Podman, and performed from the Security Analysis page.
Kubernetes provides advanced features like auto-scaling (HPA), while Docker/Podman is ideal for simple Container management on a single host. Choose the runtime that best fits your project requirements.
Accessing the Operations Modal
The Operations Modal is your central hub for service management. Follow these simple steps to access it.
How to Open
- Navigate to the [Service Management] page
- Click the Operate stage in the row of the service you want to manage
- The Operations Modal opens. (Add frequently used services to your favorites for faster access.)
Modal Tab Layout
The number of Operations Modal tabs varies by runtime type and permissions. The label of the second tab (Pod List vs Container List) and a few features change depending on whether the runtime is Kubernetes or Docker/Podman (see glossary). The Log Viewer and Command Execution tabs are shown only to users who hold the respective log and command-execution permissions for that runtime. Without those permissions, the tab count is smaller.
Kubernetes Service
- Overview: Basic service information and deployment status summary.
- Pod List: Pod list, status, bulk Pending deletion, per-Pod resource usage.
- Workload: Deployment selection, manual scaling, HPA management.
- Resources: View and clean up (delete) Deployment, Service, Ingress, ConfigMap, PVC, and Job resources (K8s only; deletion available with management permission).
- Config/Secret: Namespace-scoped ConfigMap and Secret key-value management (K8s only, requires management permission).
- Log Viewer: View Pod logs (shown when you have log permission).
- Command Execution: Run
kubectlcommands (one-shot or streaming, shown when you have command-execution permission). - Domain Settings: Manage Ingress domains.
Docker/Podman Service
- Overview: Basic service information.
- Container List: Container list, restart action, auto-refresh toggle, CPU/memory/network statistics.
- Log Viewer: View container logs (shown when you have log permission).
- Command Execution: Run
docker/podmancommands (container selection is optional, shown when you have command-execution permission). - Domain Settings: Manage service domains.
Connection Method
The operations modal supports two connection methods for reaching the target infrastructure.
- VPN: Uses a registered VPN profile.
- Direct SSH: Connects directly via SSH.
At the top of the operations modal, the current connection method is shown as a status tag (Via VPN / Direct SSH), and clicking the Change Connection Method button next to it opens the connection selection modal. When the target supports both direct and VPN access, this selection modal appears once on first entry to the operations modal; when only one access path is available, it connects directly and automatically.
Operations Scenario Guides
Choose the guide that fits your situation and follow along.
Basic Operations
Essential features for day-to-day service operations.
- Log Monitoring: View Pod/container logs to identify issues quickly.
- Container Management: Control and scale Pods/Containers to keep your service running smoothly.
- Remote Command Execution: Run
kubectl/dockercommands for in-depth debugging.
Cluster Management
Advanced management features for Kubernetes clusters. These features are accessed from the [Runtime Environment] page by selecting a K8s cluster.
- Pod Resource Metrics: Review CPU, memory, network, and disk usage collected without any installation, and check HPA prerequisites.
- K8s RBAC Management: Manage team permissions using ServiceAccounts and namespaces.
- K8s Certificate Renewal: Check and renew cluster certificates before they expire.
- HPA Auto Scaling: Automatically scale Pods up or down based on traffic.
Key Feature Details
Pod/Container Status Management
Pod Status (Kubernetes)
In the UI, the running state is highlighted in blue, pending is shown in orange, failed/error/crashloopbackoff/imagepullbackoff/errimagepull are shown in red, and all other states are shown in gray.
- Running: Running normally. No action needed.
- Pending: Scheduling or image pulling in progress. Check events in the expand row of the Pod List.
- Succeeded: Job completed. No action needed.
- Failed / CrashLoopBackOff / ImagePullBackOff / Error: Execution failed. Shown in red and requires immediate attention. (Note: the Pod List expand row can be opened not only for the
Pendingstate but also for error states such asImagePullBackOff,CrashLoopBackOff,OOMKilled,Evicted, andFailed/Error. Expanding the row shows the likely cause and remediation guidance. Check the logs and events, then use force delete if needed.) - Unknown: Unknown state. Check the node status.
- Terminating: The Pod is being terminated.
Container Status (Docker/Podman)
In the operations modal, only running and exited states have dedicated actions. paused and created states do not provide a separate action.
- running: The container is running. The UI treats any state containing
upas running. - exited: The container has stopped.
- paused / created: No separate action is provided in the UI.
Pod List Expand Row
The K8s Pod List expand row (the View Cause button) can be opened not only for Pods in the Pending state but also for error states (ImagePullBackOff, CrashLoopBackOff, OOMKilled, Failed, Evicted, etc.). The expanded row reveals:
- Root cause analysis: Guidance on possible causes for the Pending or error state (insufficient resources, nodeSelector/affinity, PVC binding, Taints/Tolerations, image pull failure, etc.).
- Events: K8s events related to the Pod.
- Force Delete: Forcibly removes Pods that do not terminate via regular deletion.
Scaling (Kubernetes)
Manual Scale
- Navigate to the Workload tab.
- Select the target Deployment.
- Enter the desired Pod count and apply.
Two actions are available:
- Apply Pod Count: Sets the Deployment replicas to the entered count.
- Remove All Pods: Sets replicas to 0 and removes all Pods.
Manual scaling is locked while an HPA is active. The backend also blocks kubectl scale in that case.
HPA (Horizontal Pod Autoscaler)
The HPA settings supported by KIOPS are limited to the following three fields:
- minReplicas: Minimum Pod count (default 1)
- maxReplicas: Maximum Pod count (default 10)
- targetCPU(%): Target CPU utilization (default 80; 70-80% is the typical starting range)
Internally, KIOPS creates HPA using kubectl autoscale --cpu-percent. See HPA Auto Scaling for details.
To use HPA, metrics-server must be installed in the cluster. KIOPS does not install it for you (see Pod Resource Metrics). The Pod List tab provides diagnostic tools — events and Pod logs — along with an "Image Cache Cleanup" action.
Log Viewer
The log viewer uses the same UI for K8s, Docker, and Podman environments.
- Target Selection: Pod or container dropdown.
- View Logs Button: Retrieves logs for the selected target.
- Clear Button: Clears the log output area.
There are no options for line count, Follow (real-time streaming), Timestamps, or Previous. For real-time streaming, use the streaming mode in the Command Execution tab.
Command Execution (Execute)
The Command Execution tab offers two modes: one-shot and streaming.
- K8s mode: There is no Pod dropdown. Enter a full
kubectlcommand. To prevent cross-namespace access, the-Aand--all-namespacesflags are blocked. - Docker/Podman mode: Container selection is optional. When unselected, the command runs on the host; when selected, the command is executed via
execagainst that container.
Per-Mode Limits
- One-shot mode:
logsandeventscommands time out at 60 seconds; all other commands time out at 30 seconds.-f,-w,exec -it, andport-forwardare blocked. - Streaming mode: Session up to 10 minutes, up to 5MB of output, up to 3 concurrent sessions per user. Blocks
exec -it,port-forward, andattach.
Commonly Used Commands
# Check processes
ps aux

# Check memory
free -m

# Disk usage
df -h

# Check network connections
netstat -tlnp
Permissions and Security
Operations features include sensitive tasks, so proper permission management is essential. If you cannot access operational features, please request permission from your organization manager.
Audit Log
For security and traceability, all operational tasks are automatically recorded in the audit log.
- Command execution history: Tracks who ran what command and when.
- Scale change history: Records changes to Pod count.
- Pod/Container deletion history: Tracks deleted resources.
- Deployment change history: Records image and configuration changes.
When issues occur, you can trace who performed what actions, helping with root cause analysis and accountability.
Troubleshooting
Common Pitfalls
- mixing up the operations modal tabs: Manual scale/HPA settings and Deployment selection live inside the "Workload" tab, not the "Pod List" tab. Resource YAML viewing is in the "Resources" tab. The operations modal has no separate "Deployment Management" tab, and rollback / image-change UI is not provided in the operations modal either. On Docker/Podman, the second tab is "Container List".
- trying to target memory with HPA: HPA in the operations modal only supports CPU-based targets. Memory-based or custom-metric autoscaling is not provided. If you really need memory-based scaling, apply an HPA YAML directly against the cluster.
- trying to open an interactive shell with
exec -it: For safety, commands that include the-itflag are blocked in both one-shot and streaming modes. To run a one-off command inside a container, drop the flag:kubectl exec <pod> -- <command>ordocker exec <container> <command>.
Common Issues
- Pod list not displayed: Caused by insufficient permissions or an inaccessible namespace. Check kubeconfig permissions.
- Log retrieval failure: Caused by a terminated Pod or network issue. Check status and events in the Pod List expand row.
- Command execution failure: A blocked option (such as
-itorport-forward) may have been included, or a timeout may have been hit. Review the limits for one-shot and streaming modes. - HPA creation failure: metrics-server is not installed in the cluster. A cluster administrator must install it directly.
Kubernetes Issues
- Persistent Pending status: Insufficient resources or a node issue. Inspect events in the Pod List expand row.
- CrashLoopBackOff: Application error. Check logs and review settings.
- ImagePullBackOff: Image pull failed. Verify the image path and registry authentication, or try the "Image Cache Cleanup" action.
Docker Issues
- Container not starting: Port conflict or volume issue. Check logs.
- No logs: Container is not outputting to stdout. Check application log settings.
Best Practices
Follow these recommendations for safe and efficient operations.
Operational Safety
Always act carefully when working in production environments.
- Use command execution with care: Always double-check before running data-modifying commands (rm, mv, etc.) in production.
- Announce "Remove All Pods" in advance: Notify relevant teams, as it causes downtime.
- Check logs regularly: Early detection of error patterns can prevent major issues.
- Review HPA settings: Set appropriate min/max values to prevent sudden scaling changes.
Incident Response Order
A systematic approach to troubleshooting helps you resolve issues faster.
- Check Overview: First, understand the overall status.
- Check Pod status: Review the Pod List and events in the expand row.
- Check logs: Analyze error messages to identify the root cause.
- Run commands: If needed, check env, processes, etc. for additional debugging.
- Restart if needed: Deleting a Pod causes the Deployment to recreate it automatically.
Having this order as a checklist helps you stay calm and methodical during emergencies.
What to Do Next
Once the layout of the Operations Modal makes sense, build up muscle memory by tackling the core features in this order.
- Log Monitoring - The first screen you reach for whenever something looks suspicious.
- Command Execution - Get comfortable with the one-shot/streaming modes and blocked options so incident response feels routine.
- HPA Auto Scaling - For traffic-variable services, decide minReplicas, maxReplicas, and targetCPU up front.
Dynamic security scanning (DAST) is no longer a tab in the Operations Modal; it is now performed from the [Security Analysis] page. For any service exposed to the outside world, schedule a regular DAST Scan.
Related Guides
- Service Build/Deploy - Pipeline overview
- DAST Scan - Dynamic security testing (performed from the [Security Analysis] page).
- Rollback - Restore previous version.